
试用新的 Lighthouse API,以衡量用户流中的性能和最佳实践。

Lighthouse 是一个出色的工具,用于在初始页面加载期间测试性能和最佳实践。但是,传统上很难使用 Lighthouse 分析页面生命周期的其他方面,例如
- 使用暖缓存加载的页面
- 具有已激活 Service Worker 的页面
- 考虑潜在的用户互动
这意味着 Lighthouse 可能会遗漏重要信息。Core Web Vitals 基于所有页面加载,而不仅仅是那些具有空缓存的页面。此外,累积布局偏移 (CLS) 等指标可以在页面打开的整个时间内进行衡量。
Lighthouse 具有新的用户流 API,允许在页面生命周期的任何时间点进行实验室测试。Puppeteer 用于编写脚本页面加载并触发合成用户互动,并且可以以多种方式调用 Lighthouse 以捕获这些互动期间的关键见解。这意味着可以在页面加载和与页面互动期间衡量性能。可以在 CI 中运行无障碍功能检查,不仅在初始视图中,而且在结账流程的深处,以确保没有任何内容发生倒退。
几乎任何为确保工作用户流而编写的 Puppeteer 脚本现在都可以在任何点插入 Lighthouse,以衡量整个流程中的性能和最佳实践。本教程将介绍新的 Lighthouse 模式,这些模式可以衡量用户流的不同部分:导航、快照和时间跨度。
设置
用户流 API 仍处于预览阶段,但它们今天已在 Lighthouse 中提供。要试用下面的演示,您需要 Node 版本 14 或更高版本。创建一个空目录,并在其中运行
# Default to ES modules.
echo '{"type": "module"}' > package.json

# Init npm project without the wizard.
npm init -y

# Dependencies for these examples.
npm install lighthouse puppeteer open
导航
新的 Lighthouse “导航”模式实际上是对(到目前为止)标准的 Lighthouse 行为进行命名:分析页面的冷加载。这是用于监控页面加载性能的模式,但用户流也打开了获得新见解的可能性。
要编写 Lighthouse 捕获页面加载的脚本
- 使用 Puppeteer 打开浏览器。
- 启动 Lighthouse 用户流。
- 导航到目标 URL。
import fs from 'fs';
import open from 'open';
import puppeteer from 'puppeteer';
import {startFlow} from 'lighthouse/lighthouse-core/fraggle-rock/api.js';

async function captureReport() {
  const browser = await puppeteer.launch({headless: false});
  const page = await browser.newPage();

  const flow = await startFlow(page, {name: 'Single Navigation'});
  await flow.navigate('https://webdev.ac.cn/performance-scoring/');

  await browser.close();

  const report = await flow.generateReport();
  fs.writeFileSync('flow.report.html', report);
  open('flow.report.html', {wait: false});
}

captureReport();
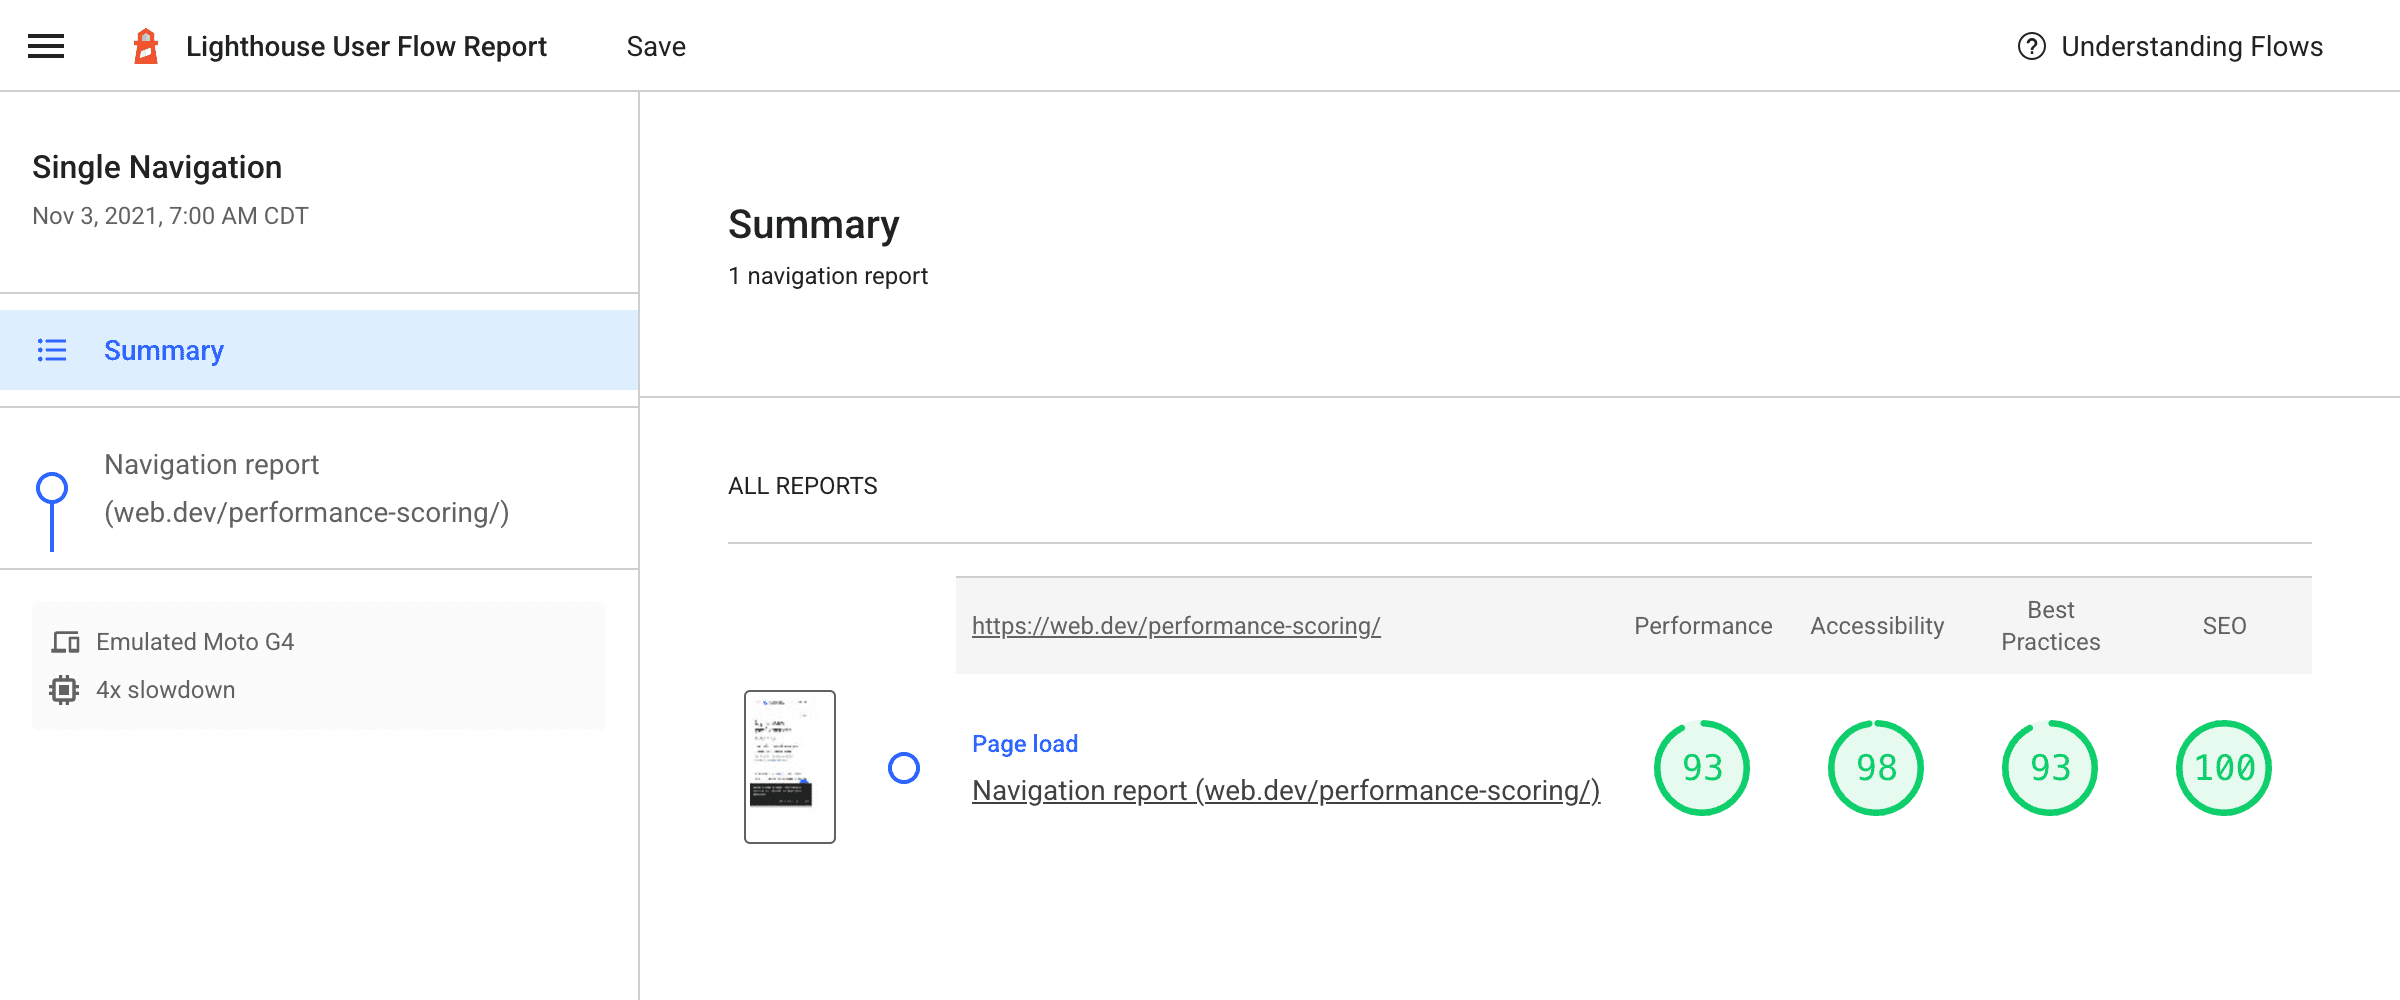
这是最简单的流程。打开后,报告会显示一个摘要视图,其中仅包含单个步骤。单击该步骤将显示该导航的传统 Lighthouse 报告。
与 Lighthouse 的典型情况一样,此页面在加载时首先清除了任何缓存或本地存储,但访问站点的真实用户将混合访问冷缓存和暖缓存,并且冷加载(如本例所示)与用户返回到仍然是暖缓存的页面之间可能存在很大的性能差异。
捕获暖加载
您还可以向此脚本添加第二个导航,这次禁用 Lighthouse 在导航中默认执行的清除缓存和存储。下一个示例加载 web.dev 本身的一篇文章,以查看它从缓存中受益多少
async function captureReport() {
  const browser = await puppeteer.launch({headless: false});
  const page = await browser.newPage();

  const testUrl = 'https://webdev.ac.cn/performance-scoring/';
  const flow = await startFlow(page, {name: 'Cold and warm navigations'});
  await flow.navigate(testUrl, {
    stepName: 'Cold navigation'
  });
  await flow.navigate(testUrl, {
    stepName: 'Warm navigation',
    configContext: {
      settingsOverrides: {disableStorageReset: true},
    },
  });

  await browser.close();

  const report = await flow.generateReport();
  fs.writeFileSync('flow.report.html', report);
  open('flow.report.html', {wait: false});
}

captureReport();
生成的流程报告看起来像这样
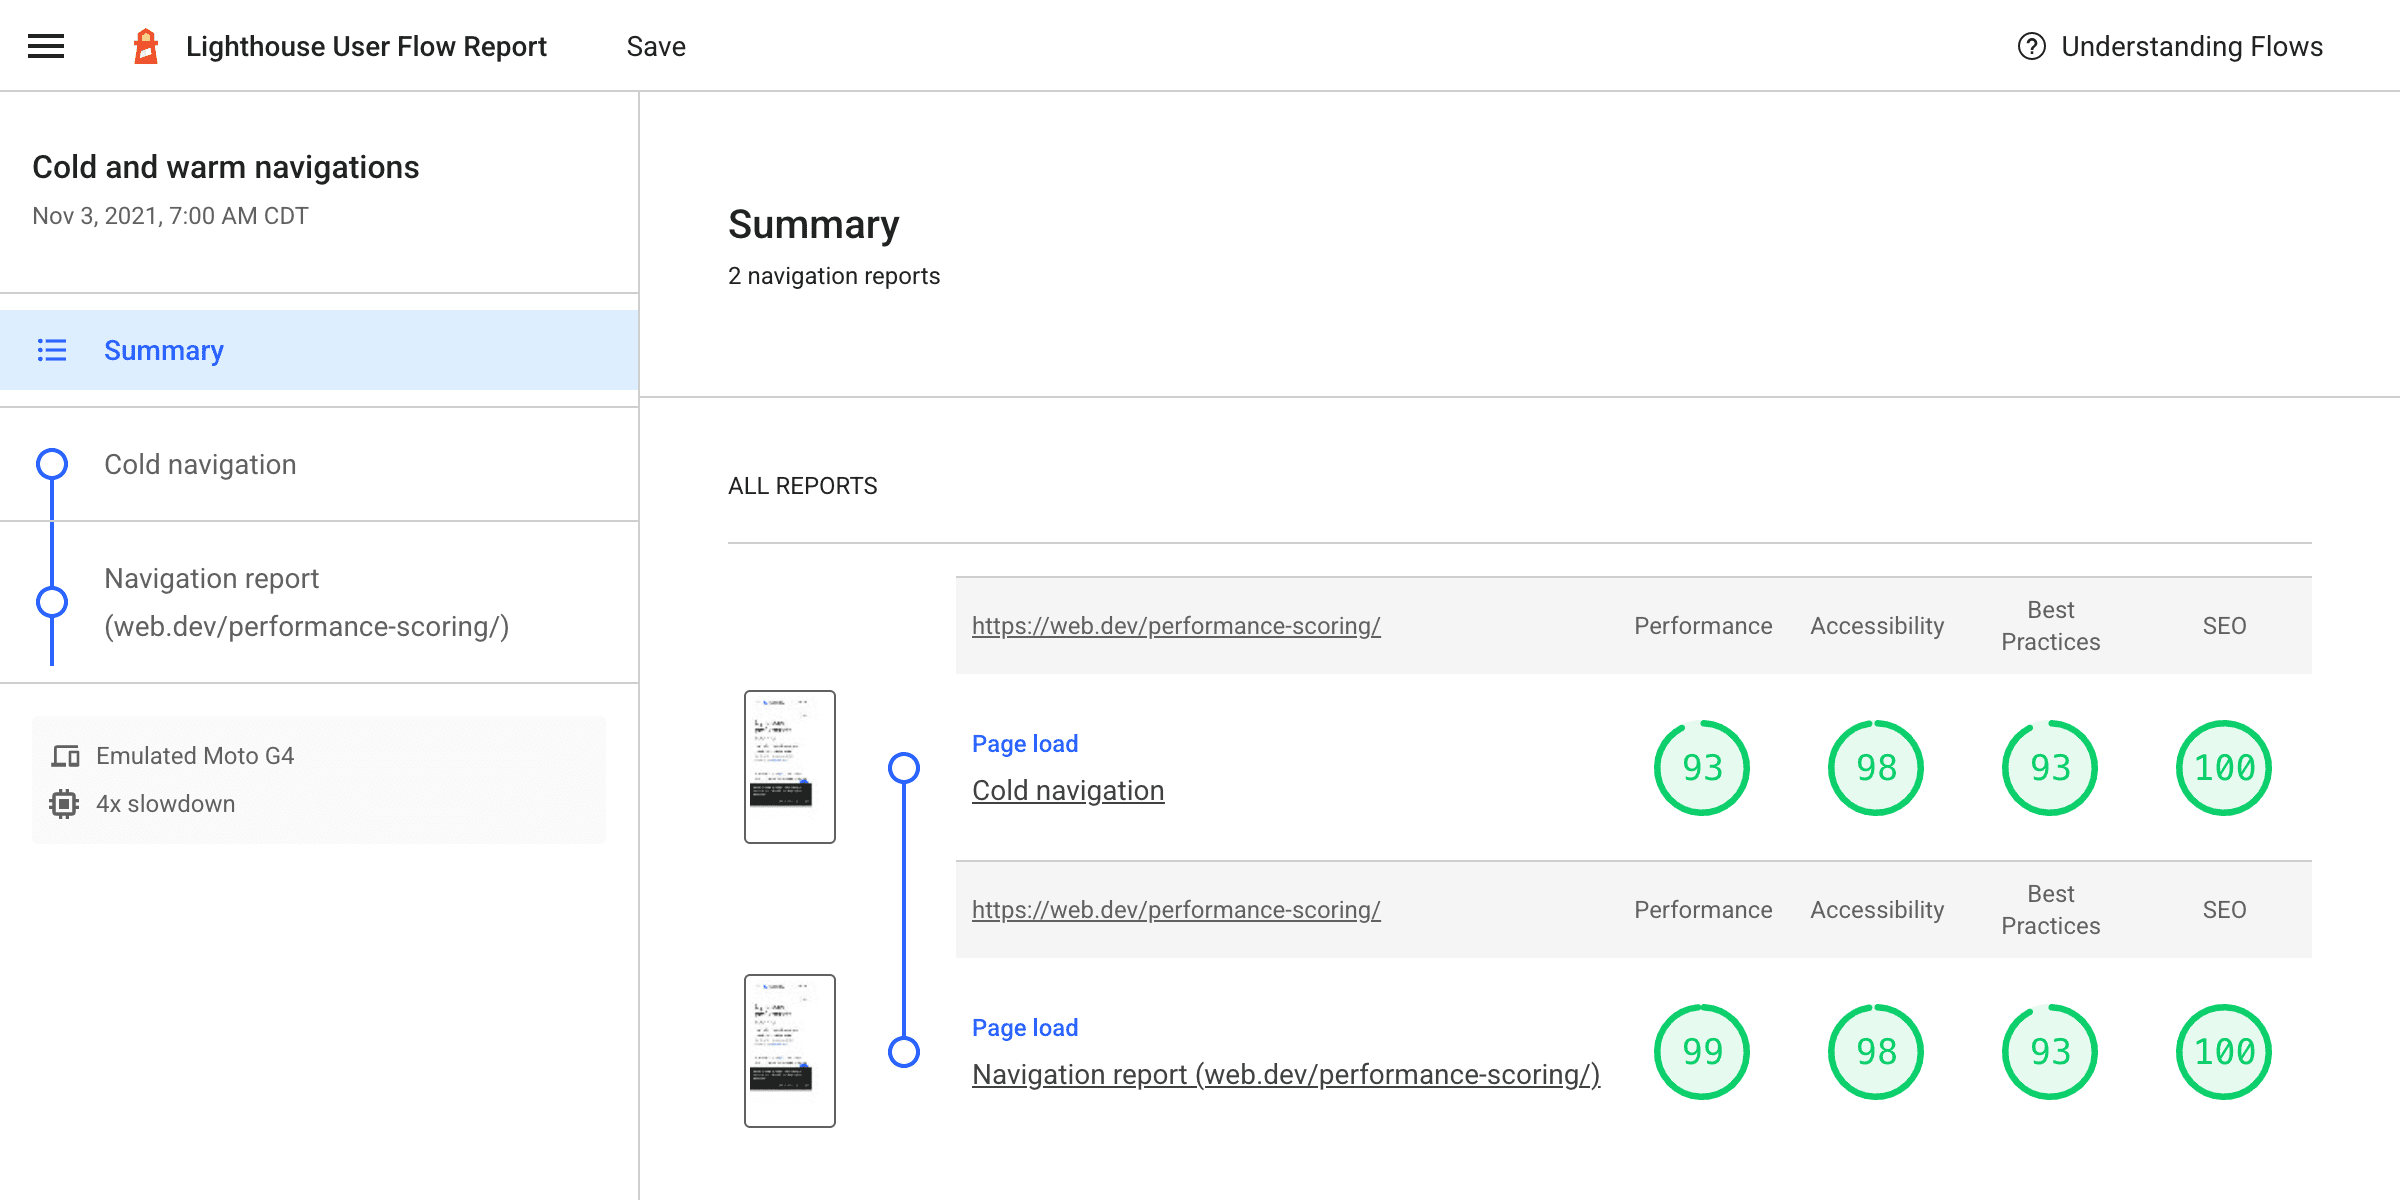
冷加载和暖加载的组合提供了真实用户体验的更全面的画面。如果您的站点用户在同一次访问中加载许多页面,这可能会让您更真实地了解他们在现场的体验。
快照
快照是一种新模式,它在单个时间点运行 Lighthouse 审核。与正常的 Lighthouse 运行不同,页面不会重新加载。这解锁了设置页面并在其确切状态下进行测试的能力:例如,在下拉菜单打开或表单部分填写的情况下。
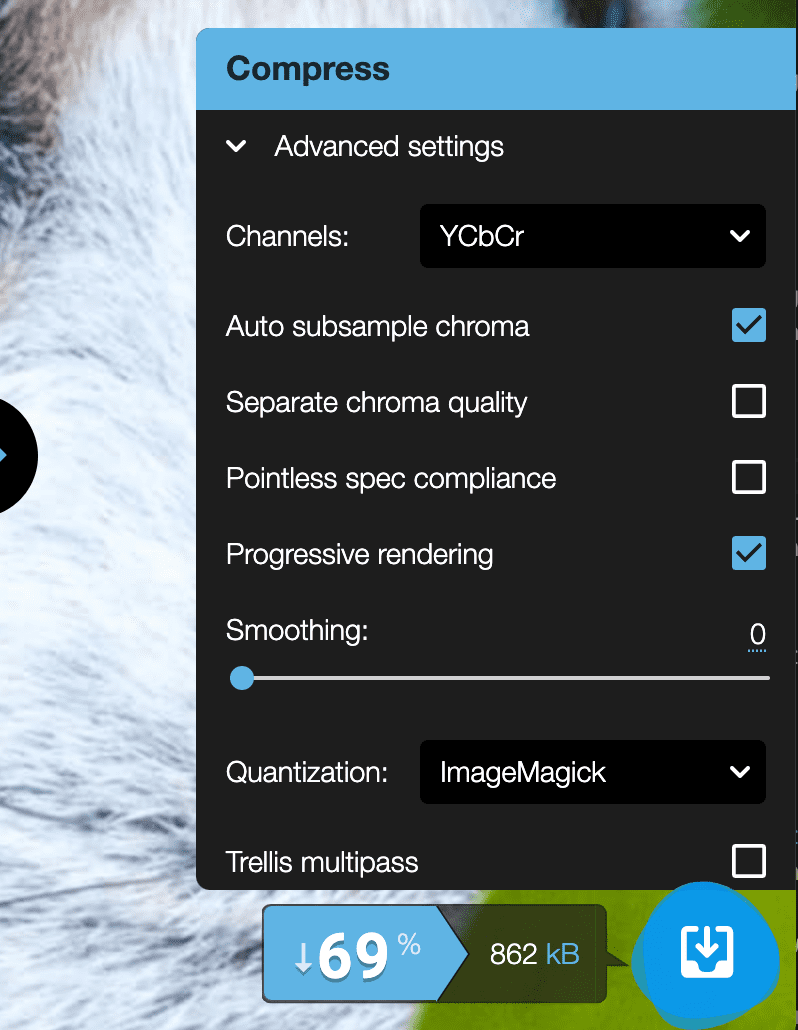
对于此示例,假设您要检查 Squoosh 中高级设置的某些新 UI 是否通过了自动 Lighthouse 检查。只有在加载图像并且选项菜单展开以显示高级设置后,这些设置才可见。
此过程可以通过 Puppeteer 编写脚本,您实际上可以在每个步骤中拍摄 Lighthouse 快照
async function captureReport() {
  const browser = await puppeteer.launch({headless: false});
  const page = await browser.newPage();

  const flow = await startFlow(page, {name: 'Squoosh snapshots'});

  await page.goto('https://squoosh.app/', {waitUntil: 'networkidle0'});

  // Wait for first demo-image button, then open it.
  const demoImageSelector = 'ul[class*="demos"] button';
  await page.waitForSelector(demoImageSelector);
  await flow.snapshot({stepName: 'Page loaded'});
  await page.click(demoImageSelector);

  // Wait for advanced settings button in UI, then open them.
  const advancedSettingsSelector = 'form label[class*="option-reveal"]';
  await page.waitForSelector(advancedSettingsSelector);
  await flow.snapshot({stepName: 'Demo loaded'});
  await page.click(advancedSettingsSelector);

  await flow.snapshot({stepName: 'Advanced settings opened'});

  browser.close();

  const report = await flow.generateReport();
  fs.writeFileSync('flow.report.html', report);
  open('flow.report.html', {wait: false});
}

captureReport();
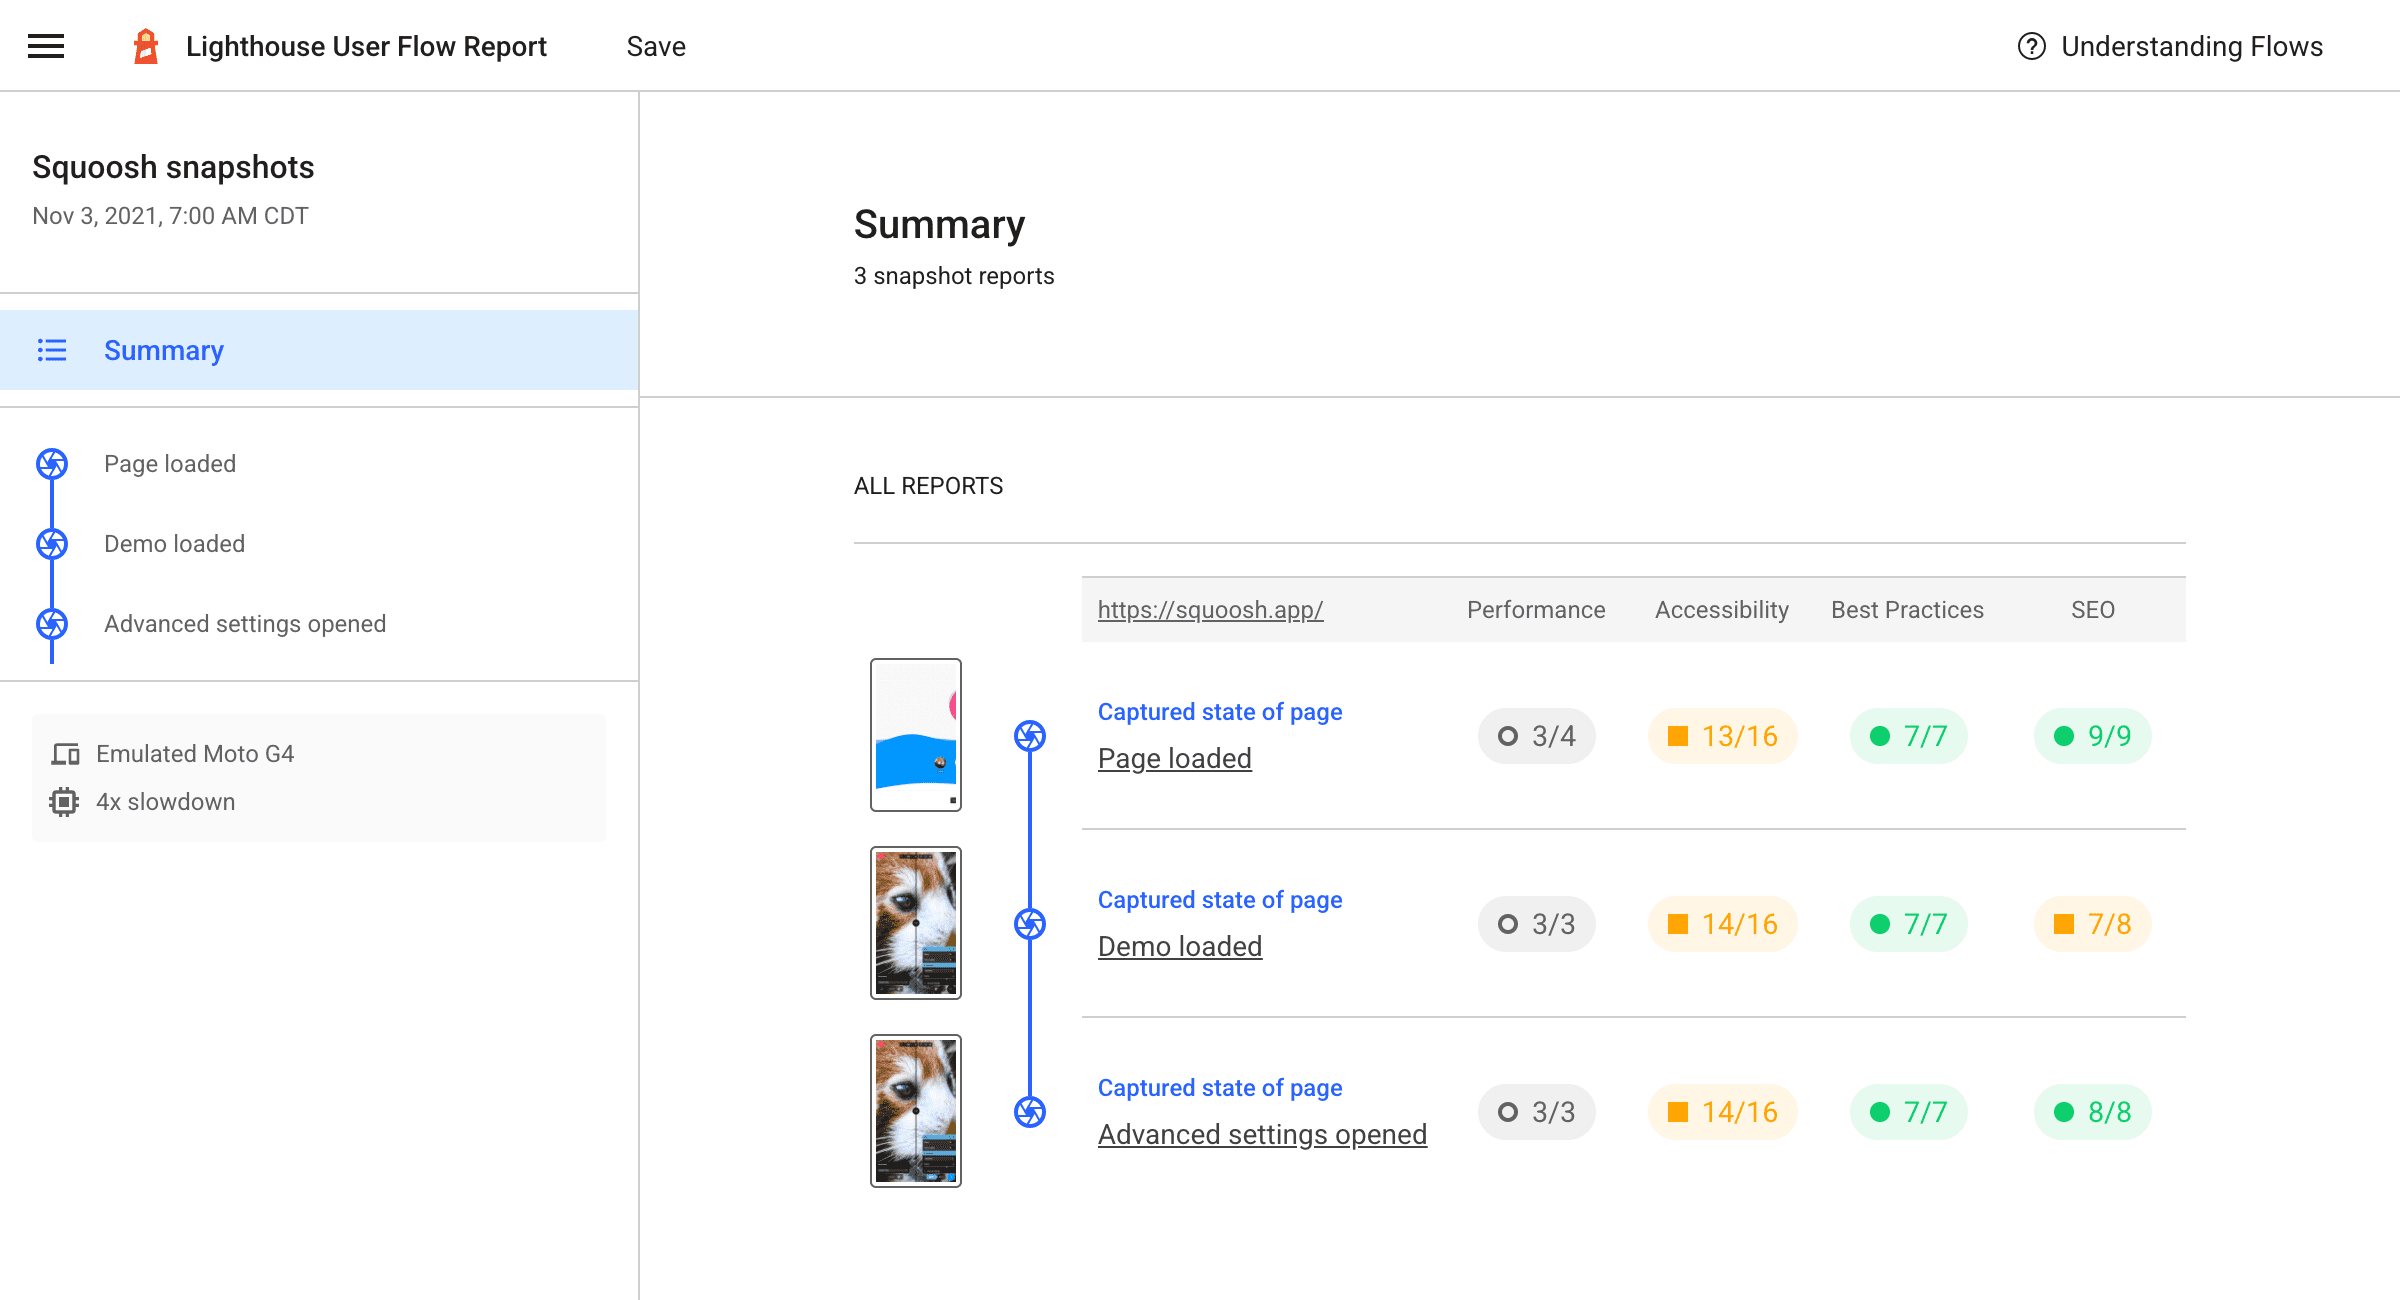
生成的报告显示结果总体良好,但可能需要手动检查一些无障碍功能标准
时间跨度
现场(如来自 CrUX)的性能结果与实验室(如来自 Lighthouse)的性能结果之间最大的差异之一是缺少用户输入。这就是时间跨度(最后一种用户流模式)可以提供帮助的地方。
时间跨度在一段时间内运行 Lighthouse 审核,这段时间可能包含也可能不包含导航。这是捕获页面在互动期间发生的情况的好方法。例如,默认情况下,Lighthouse 在页面加载期间测量 CLS,但在现场,CLS 是从初始导航到页面关闭之间进行测量的。如果用户互动是 CLS 的触发因素,那么这是 Lighthouse 以前无法捕获和帮助修复的问题。
为了演示这一点,这是一个 测试站点,它模拟在滚动期间将广告注入到文章中,而没有为其保留空间。在长系列卡片中,当红色方块的插槽进入视口时,会偶尔添加一个红色方块。由于没有为这些红色方块保留空间,因此它们下方的卡片被移开,从而导致布局偏移。
常规 Lighthouse 导航的 CLS 将为 0。但是,一旦滚动,页面将出现有问题的布局偏移,并且 CLS 值将升高。
以下脚本将生成一个包含两个操作的用户流报告,以显示差异。
async function captureReport() {
  const browser = await puppeteer.launch({headless: false});
  const page = await browser.newPage();
  // Get a session handle to be able to send protocol commands to the page.
  const session = await page.target().createCDPSession();

  const testUrl = 'https://pie-charmed-treatment.glitch.me/';
  const flow = await startFlow(page, {name: 'CLS during navigation and on scroll'});

  // Regular Lighthouse navigation.
  await flow.navigate(testUrl, {stepName: 'Navigate only'});

  // Navigate and scroll timespan.
  await flow.startTimespan({stepName: 'Navigate and scroll'});
  await page.goto(testUrl, {waitUntil: 'networkidle0'});
  // We need the ability to scroll like a user. There's not a direct puppeteer function for this, but we can use the DevTools Protocol and issue a Input.synthesizeScrollGesture event, which has convenient parameters like repetitions and delay to somewhat simulate a more natural scrolling gesture.
  // https://chromedevtools.github.io/devtools-protocol/tot/Input/#method-synthesizeScrollGesture
  await session.send('Input.synthesizeScrollGesture', {
    x: 100,
    y: 600,
    yDistance: -2500,
    speed: 1000,
    repeatCount: 2,
    repeatDelayMs: 250,
  });
  await flow.endTimespan();

  await browser.close();

  const report = await flow.generateReport();
  fs.writeFileSync('flow.report.html', report);
  open('flow.report.html', {wait: false});
}

captureReport();
这将生成一个报告,比较常规导航和包含导航和后续滚动的时间跨度
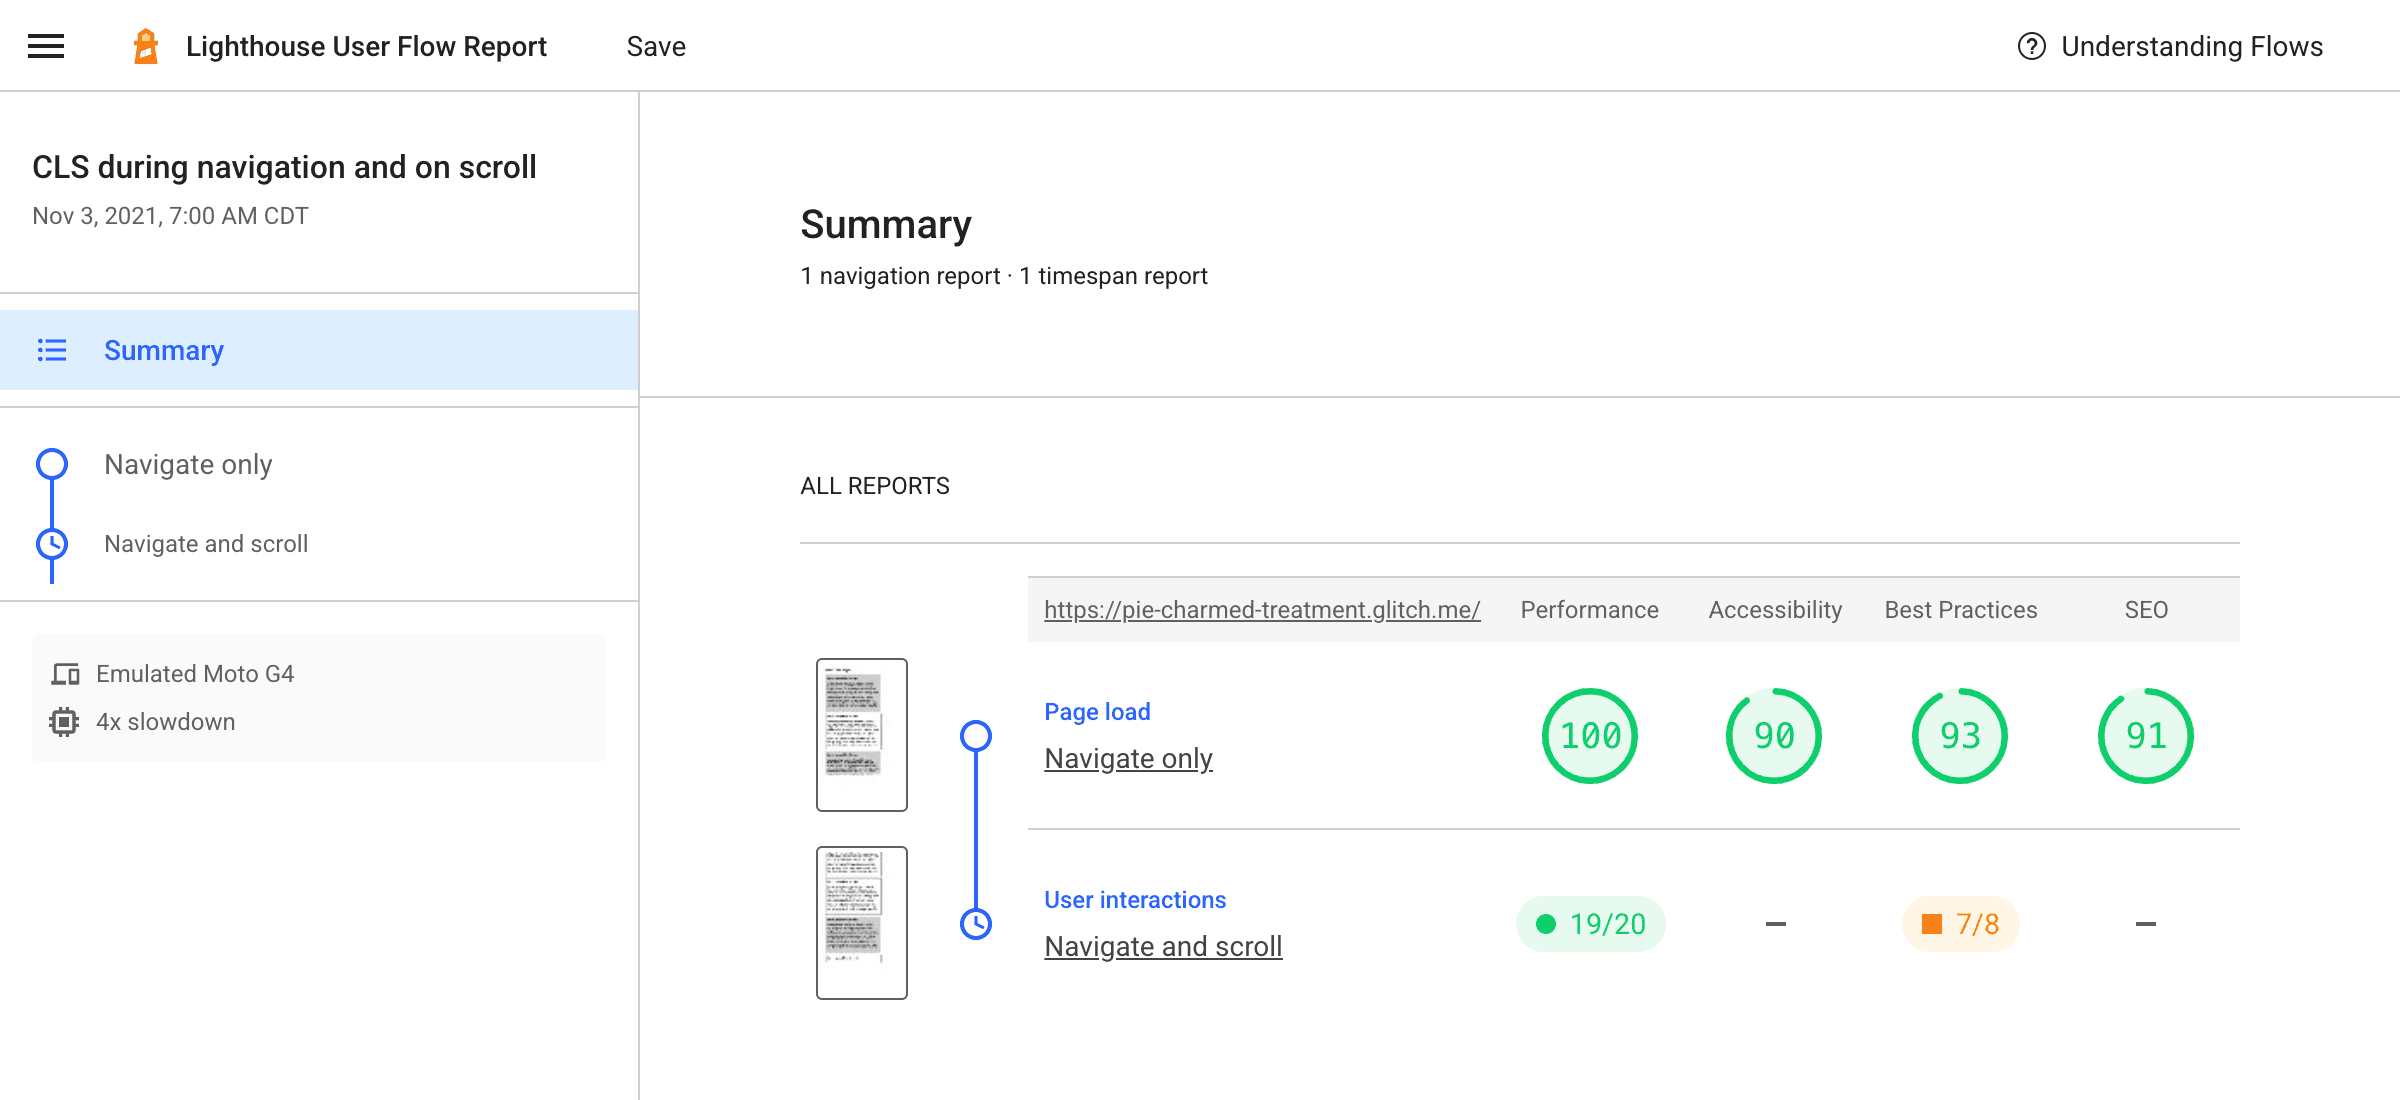
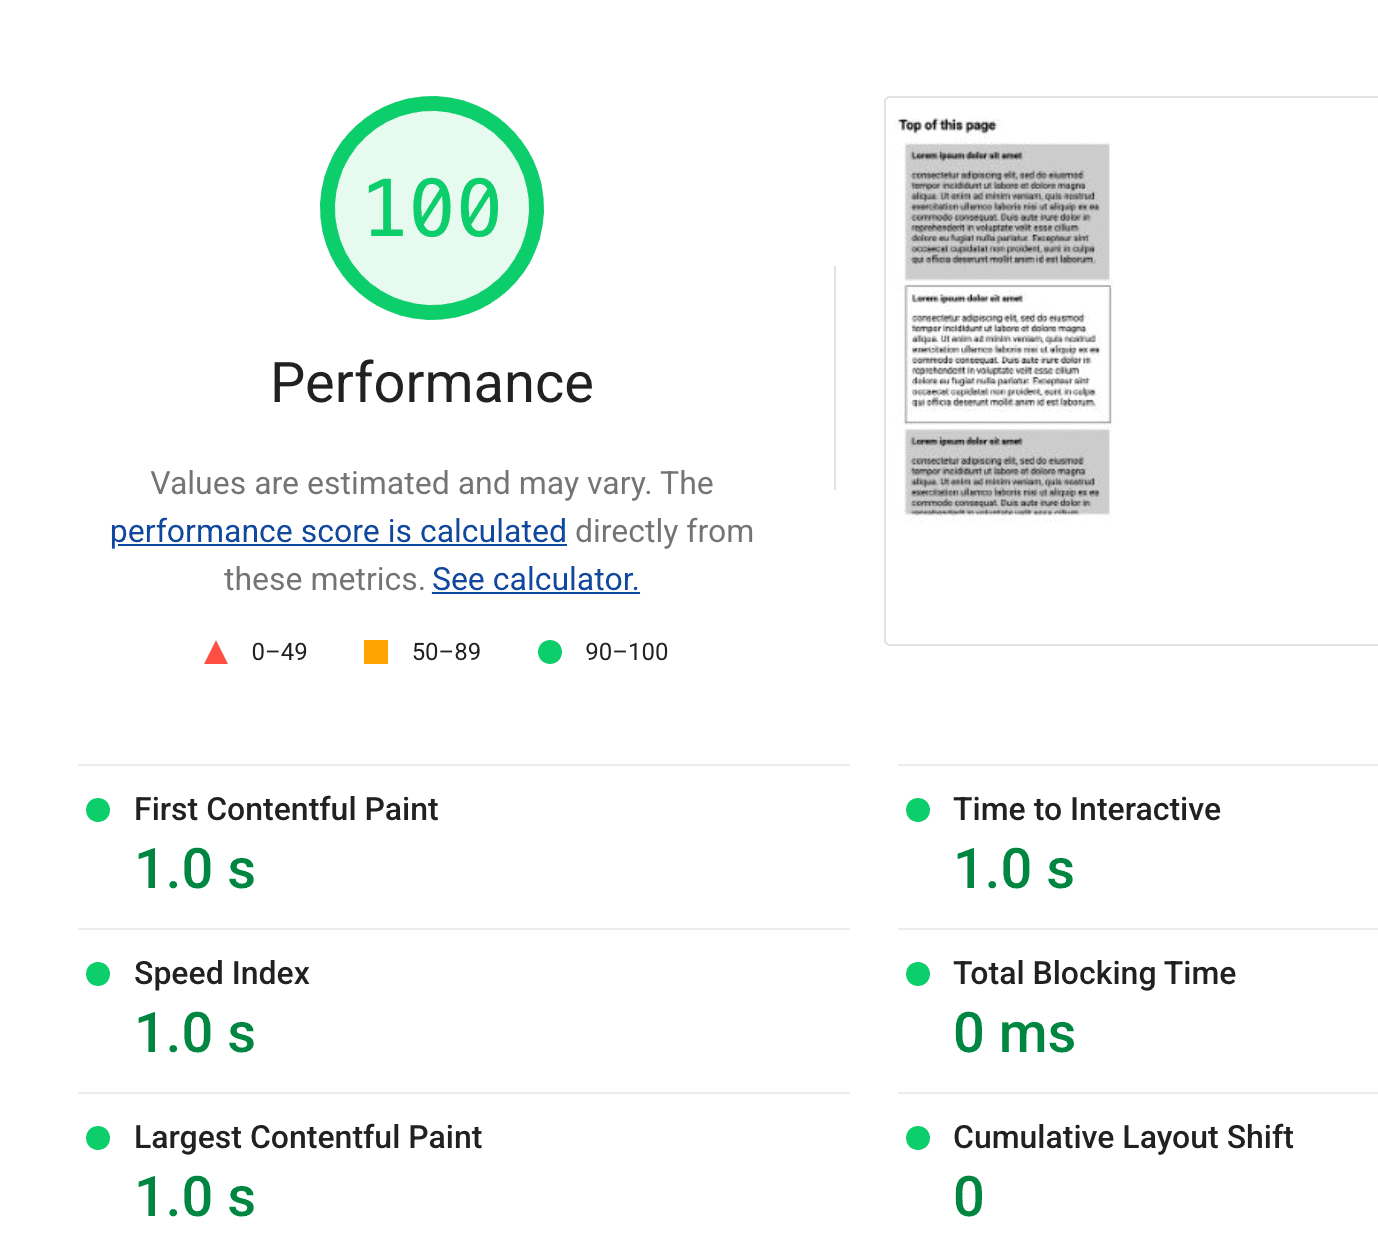
深入研究每个步骤,仅导航步骤显示的 CLS 为 0。很棒的站点!
但是“导航和滚动”步骤讲述了一个不同的故事。目前,时间跨度中仅提供总阻塞时间和累积布局偏移,但此页面上的延迟加载内容显然会降低站点的 CLS。
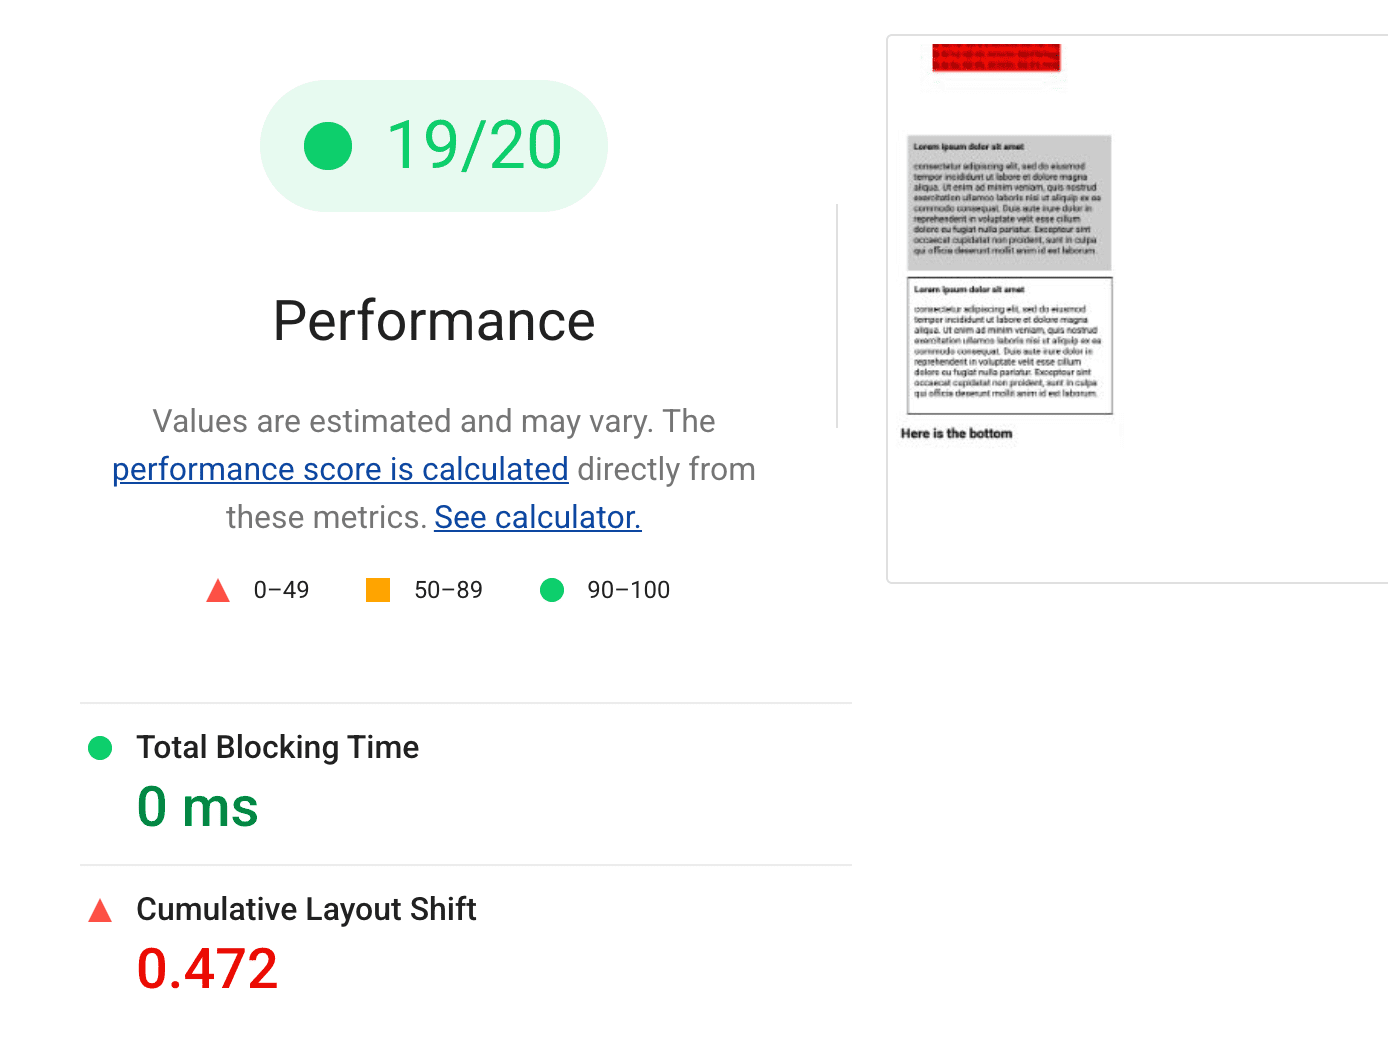
以前,Lighthouse 将无法识别这种有问题的 CLS 行为,尽管它几乎肯定会在真实用户的体验中显示出来。通过编写脚本互动进行的性能测试显着提高了实验室的保真度。
寻求反馈
Lighthouse 中的新用户流 API 可以执行许多新操作,但衡量您的用户遇到的场景类型可能仍然很复杂。